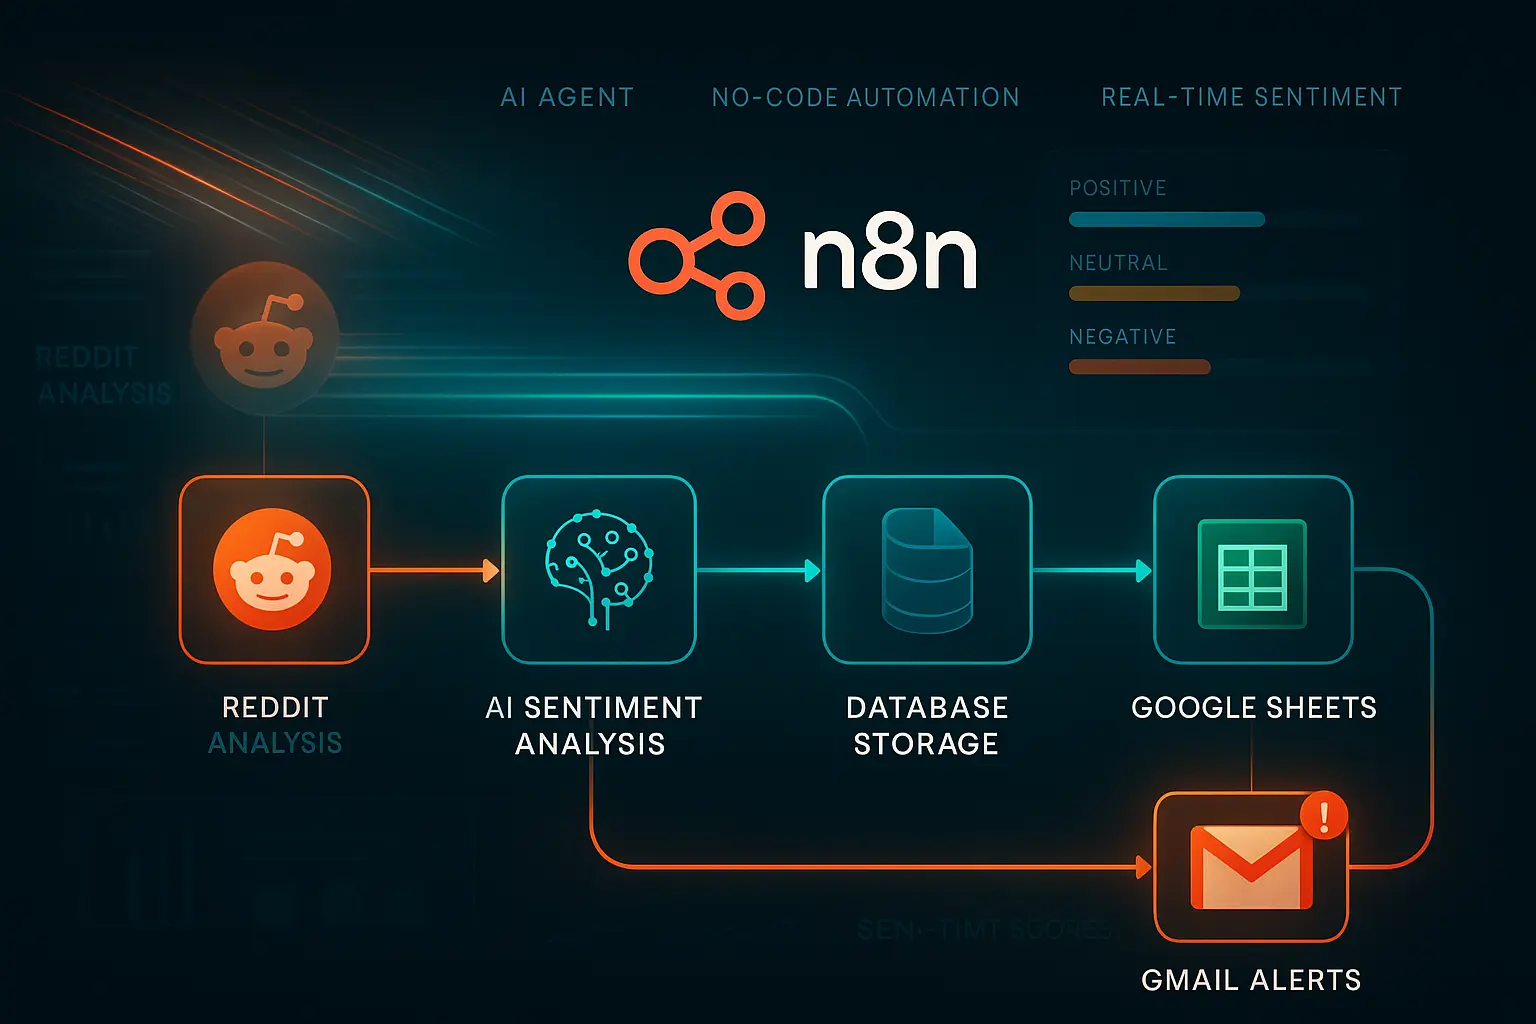
Building an Automated Sentiment Analysis Workflow with n8n and Reddit
Learn how to build a powerful automated workflow in n8n to gather Reddit data, perform AI-powered sentiment analysis, and deliver actionable reports and alerts to your database, spreadsheets, and email.
Introduction
My goal for this blog post is to write a step-by-step guide on how to set up a sentiment analysis workflow on n8n. In addition, the workflow will be able to gather data from different sources on the internet, but we'll keep things simple by using Reddit as our only data source. Finally, it will format the analysis results into three outputs:
- For the database
- For a spreadsheet for reporting
- As an HTML email for alerts
Why This Workflow is Needed
Before we get our hands dirty, let's take a quick look at why this workflow is needed in the first place. Imagine an automated system that constantly searches the internet for what people are saying about your products, brand, company, or whatever else you care about. It then uses an AI agent to analyze this data for sentiment, sends you a report, and alerts you when negative sentiment hits a certain percentage, all while saving the report for your records.
All of this happens with zero human interaction. What you have is something that keeps you up-to-date, even before your competitors know. It helps you see what customers are saying about your brand and know what prospective clients are saying. If you run a business or have a brand, I'm certain you already see the point. It's mind-blowing, right? Yes, I know.
With that being said, let's get to work.
Assumptions
I'll be making certain assumptions moving forward:
- You're familiar with the basics of n8n
- You're comfortable writing simple JavaScript code
- You can write HTML code
Don't worry, I'll be providing the code; it just makes things easier if you understand what they do.
We're going to have a total of 15 nodes in this workflow.
Step 1: The Schedule Trigger Node
The first node is always a trigger node, in this case, a Schedule Trigger node. This will help us create a schedule for how often we want this automation to run and also double as what starts the automation.
Now, add the Schedule Trigger node and use the following settings:
- Trigger interval: Days
- Days Between Triggers: 1
- Trigger at Hour: 8am
- Trigger at Minute: 0
Finally, click on Add rule.
With these settings, your automation will run at 8 AM every day. Feel free to use any schedule you prefer.
Step 2: The Edit Fields (Set) Node
This node does a couple of things. It can add, remove, or modify existing data. We're using it to set new fields in this case. This essentially helps us set the values we're interested in.
So, let's assume we're interested in the company Tesla. We'll probably be interested in keywords like "Tesla," "Elon Musk," and "TSLA." Feel free to swap these out for what makes sense for your business.
We'll use the following settings:
- Mode: Manual Mapping
- Click on Add Field
Field 1
- Name:
company_name - Data type: String
- Value:
Tesla
Field 2
- Name:
search_terms - Data type: String
- Value:
Tesla, Elon Musk, TSLA
Field 3
- Name:
analysis_timestamp - Data type: Data
- Value:
{{ $now.toISO() }}(The value must be an expression)
Step 3: The Reddit Node - Search for Posts
This node will be responsible for pulling data from Reddit. You can replace this with your platform(s) of choice.
Set the following:
- Credential for Reddit OAuth2 API: If you don't have one, you need to create a Reddit app here: https://www.reddit.com/prefs/apps. Get your client secret and client ID and use them to create new credentials on n8n.
- Resource: Post
- Operation: Search
- Location: All Reddit
- Keyword (Expression):
{{ $json.search_terms }} - Return all: Unchecked
- Limit: 10
Additional Fields
- Sort: Relevance
This essentially searches all of Reddit using your search terms from the previous node.
Step 4: Code Node (Data Formatting)
After getting the data, we need to format it properly for our next node (the AI agent node). We will use JavaScript to normalize the data.
Use the following settings:
- Mode: Run Once for All Items
- Language: JavaScript
- Code:
const normalizedData = [];

for (const item of $input.all()) {
  if (item.json.title && item.json.selftext !== undefined) {
    const normalizedItem = {
      id: item.json.id,
      text: `${item.json.title}. ${item.json.selftext || ""}`.trim(),
      source: "reddit",
      url: `https://reddit.com${item.json.permalink}`,
      author: item.json.author,
      created_at: new Date(item.json.created_utc * 1000).toISOString(),
      engagement_metrics: {
        score: item.json.score,
        comments: item.json.num_comments,
        upvotes: item.json.ups,
      },
    };

    normalizedData.push(normalizedItem);
  }
}

return normalizedData.map((item) => ({ json: item }));
Step 5: AI Agent Node
An AI agent node is a special node because it can do much more. It can use external tools, connect to an LLM, use memory, and much more.
We'll use it to perform the sentiment analysis on our formatted data.
Let's use the following settings:
- Source for Prompt (User Message): Define below
- Prompt (User Message):
{{ $json.text }}(Must be an expression) - Require Specific Output Format: Checked
- Add option: System Message:
You are a Sentiment Analysis AI Agent designed to analyze Reddit data exclusively.

Your objective is to process Reddit posts, perform sentiment classification, and return structured, concise insights for each entry.

Functional Responsibilities:

1. Ingest Reddit Data:
   - Each entry includes a Reddit post's `title` and `selftext` combined into one text field.
   - You will also receive metadata such as `author`, `url`, `score`, `num_comments`, `ups`, and `created_at`.

2. Preprocessing:
   - Remove emojis, URLs, formatting artifacts, and Reddit-specific noise (e.g., usernames like "u/...", markdown formatting, hashtags).

3. Sentiment Classification:
   - Label each post's sentiment as **Positive**, **Negative**, or **Neutral**.

4. Confidence Scoring:
   - Assign a `confidence` value between 0 and 1 for your classification.

5. Highlight Key Phrases:
   - Extract up to **3 key emotionally or topically relevant phrases** that support the sentiment.

6. Metadata Awareness:
   - Factor in Reddit engagement metrics (`score`, `upvotes`, `num_comments`) and `created_at` when assessing tone and strength of sentiment.

7. Output Format (one JSON object per post):

{
  "id": "abc123",
  "text": "Original post text...",
  "sentiment": "Positive",
  "confidence": 0.92,
  "key_phrases": ["example phrase 1", "example phrase 2", "example phrase 3"],
  "created_at": "2025-07-22T10:30:00Z",
  "url": "https://reddit.com/r/example",
  "author": "user123",
  "engagement_metrics": {
    "score": 123,
    "comments": 10,
    "upvotes": 100
  }
}
- Add a chat model of your choice (this will greatly affect the quality of your analysis)
Step 6: Code Node (Output Formatting)
We are using a Code node again, this time to also format the LLM output for our spreadsheet, database, and email reports.
Let's configure it:
- Mode: Run Once for All Items
- Language: JavaScript
- Code:
const items = $input.all();
const results = [];
const summary = {
  total_entries: 0,
  positive: 0,
  negative: 0,
  neutral: 0,
  avg_confidence: 0,
  positive_percentage: 0,
  negative_percentage: 0,
  neutral_percentage: 0,
  sources: {},
  top_indicators: {},
  analysis_timestamp: new Date().toISOString(),
};

let totalConfidence = 0;

// Single loop to both transform items AND build summary
for (const item of items) {
  let sentimentData;

  try {
    // Parse the JSON response from the AI agent
    const aiResponse = JSON.parse(item.json.output);
    sentimentData = {
      id: aiResponse.id || null,
      text: aiResponse.text || "",
      sentiment: aiResponse.sentiment || "NEUTRAL",
      confidence: aiResponse.confidence ?? 0.5,
      key_indicators: aiResponse.key_phrases || [],
      reasoning: "", // Not returned by AI yet
      analysis_timestamp: new Date().toISOString(),
      company_name: "Tesla", // Customize as needed
      platform: "Reddit",
      created_at: aiResponse.created_at || null,
      url: aiResponse.url || "",
      author: aiResponse.author || "",
      engagement_metrics: aiResponse.engagement_metrics || {},
    };
  } catch (error) {
    sentimentData = {
      sentiment: "NEUTRAL",
      confidence: 0.5,
      key_indicators: ["parsing_error"],
      reasoning: "AI response parsing failed",
      analysis_timestamp: new Date().toISOString(),
      company_name: "Tesla",
      platform: "Reddit",
    };
  }

  // Add to results array
  results.push({ json: sentimentData });

  // Build summary data simultaneously
  summary.total_entries++;

  // Normalize sentiment for counting
  const sentiment =
    typeof sentimentData.sentiment === "string"
      ? sentimentData.sentiment.toLowerCase()
      : "neutral";

  if (sentiment === "positive") {
    summary.positive++;
  } else if (sentiment === "negative") {
    summary.negative++;
  } else {
    summary.neutral++;
  }

  // Sum confidence score
  const confidence =
    typeof sentimentData.confidence === "number" ? sentimentData.confidence : 0;
  totalConfidence += confidence;

  // Handle platform (sources)
  const platform =
    typeof sentimentData.platform === "string"
      ? sentimentData.platform
      : "unknown";
  summary.sources[platform] = (summary.sources[platform] || 0) + 1;

  // Count key indicators
  if (Array.isArray(sentimentData.key_indicators)) {
    for (const phrase of sentimentData.key_indicators) {
      if (typeof phrase === "string") {
        summary.top_indicators[phrase] =
          (summary.top_indicators[phrase] || 0) + 1;
      }
    }
  }
}

// Final calculations
summary.avg_confidence =
  summary.total_entries > 0
    ? Number((totalConfidence / summary.total_entries).toFixed(2))
    : 0;

summary.positive_percentage =
  summary.total_entries > 0
    ? Number(((summary.positive / summary.total_entries) * 100).toFixed(1))
    : 0;

summary.negative_percentage =
  summary.total_entries > 0
    ? Number(((summary.negative / summary.total_entries) * 100).toFixed(1))
    : 0;

summary.neutral_percentage =
  summary.total_entries > 0
    ? Number(((summary.neutral / summary.total_entries) * 100).toFixed(1))
    : 0;

// Get top 5 indicators safely
const sortedIndicators = Object.entries(summary.top_indicators)
  .sort((a, b) => b[1] - a[1])
  .slice(0, 5);

const topIndicators = {};
for (const [phrase, count] of sortedIndicators) {
  topIndicators[phrase] = count;
}
summary.top_indicators = topIndicators;

// Generate HTML table rows
const sourcesTableRows = Object.entries(summary.sources)
  .map(([source, count]) => `<tr><td>${source}</td><td>${count}</td></tr>`)
  .join("");

const indicatorsTableRows = Object.entries(summary.top_indicators)
  .map(([phrase, count]) => `<tr><td>${phrase}</td><td>${count}</td></tr>`)
  .join("");

summary.sourcesTableRows = sourcesTableRows;
summary.indicatorsTableRows = indicatorsTableRows;

// Add summary as the last item with a flag to identify it
results.push({ json: { ...summary, _summary: true } });

return results;
At this point, we have our analyzed data formatted and ready for different destinations.
Step 7: The Switch Node
This is where we split the data into two branches: a summary branch for our email reports and spreadsheet, and a detailed analysis for our database.
Use the following configurations:
- Mode: Expression
- Number of Outputs: 2
- Output index:
{{ $json._summary === true }}
Sit tight, things are about to get a little complicated, but we'll walk through it together. Before now, the connections were linear, but that's about to change.
The Switch node has two outputs. We will be sharing these two outputs among three nodes. Stay with me: Output 0 contains 10 items (individual objects containing details of the analysis), while Output 1 contains 1 item (the summary).
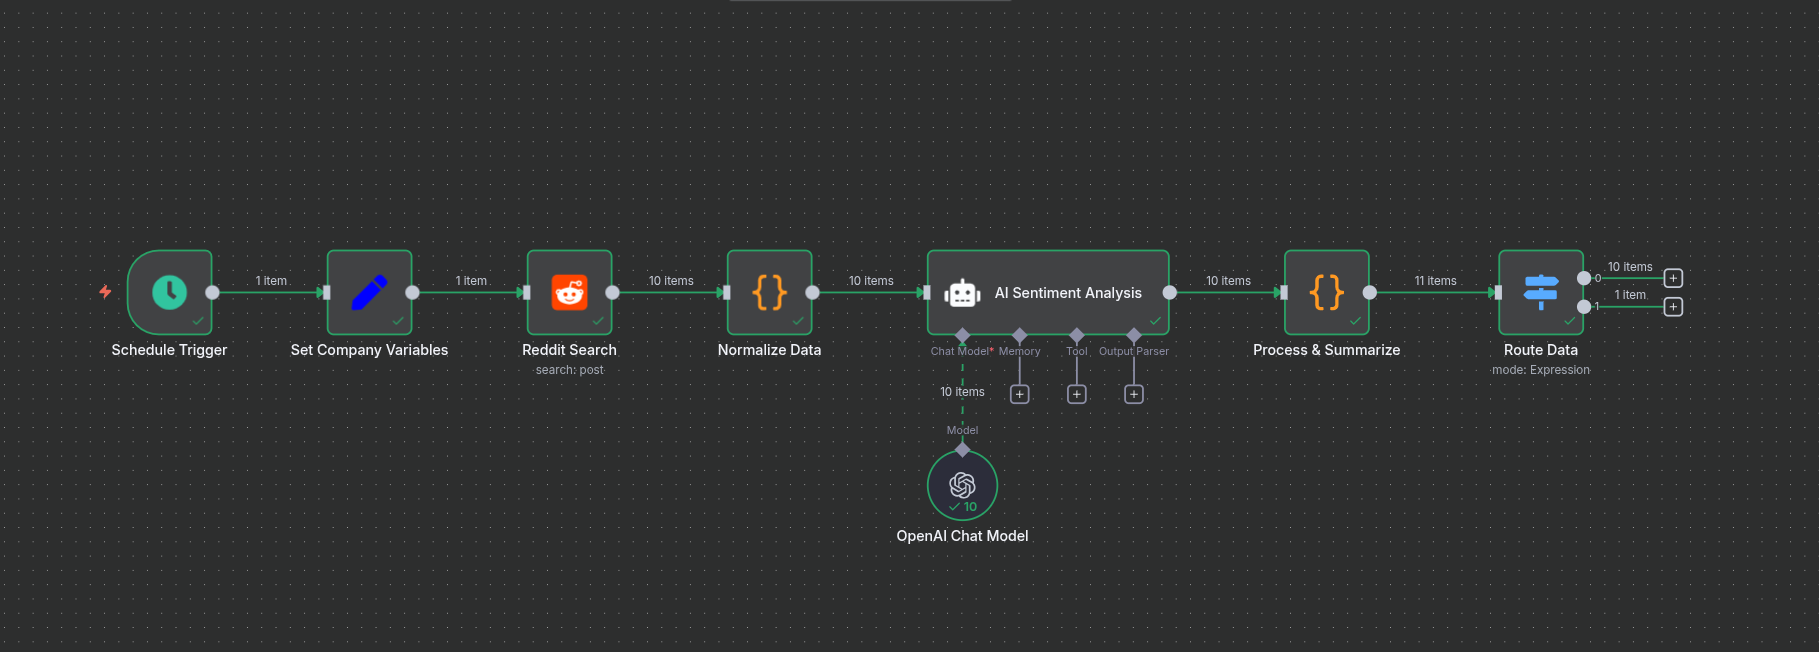
This is what your workflow should look like at this point:
Step 8: Save to PostgreSQL Node
Map Output 0 from the Switch node to this node and configure it. You'll need your credentials and the information for the table you want to save to. (If you don't want to save to a database, you can skip this node without issues.)
Step 9: Code Node (Spreadsheet Formatting)
Again? Yes! We will use it to format our results for the spreadsheet. Map Output 0 from the Merge node again to this node and use the following settings:
- Mode: Run Once for All Items
- Language: JavaScript
- Code:
const items = $input.all();
const firstItem = items[0].json;
const headers = Object.keys(firstItem);

const headerRow = headers.map((header) => ({
  userEnteredValue: { stringValue: header },
}));

const dataRows = items.map((item) => {
  return headers.map((header) => {
    const value = item.json[header];
    let cellValue = "";
    if (Array.isArray(value)) {
      cellValue = value.join(", ");
    } else if (typeof value === "object" && value !== null) {
      cellValue = JSON.stringify(value);
    } else {
      cellValue = String(value || "");
    }
    return { userEnteredValue: { stringValue: cellValue } };
  });
});

const allRows = [headerRow, ...dataRows];
const timestamp = new Date().toISOString().slice(0, 19).replace(/:/g, "-");

return {
  json: {
    spreadsheetTitle: `Sentiment Analysis ${timestamp}`,
    sheetData: [
      {
        properties: { title: "Detailed Data" },
        data: [
          {
            rowData: allRows.map((row) => ({ values: row })),
          },
        ],
      },
    ],
  },
};
Step 10: HTTP Node (Google Sheets API)
Here, we'll be creating our spreadsheet and updating it in one go using the Google Sheets API.
Maybe you've used the Google Sheet node and are wondering why we aren't using that. Here's why: Firstly, that would require two different nodes. One for creating the spreadsheet and the second for appending the rows. Secondly, there's no easy way to get your data through to the append sheet node after creating the spreadsheet because it doesn't return data from the previous node.
Moving on, map the Code node to this node, and let's use the following configuration:
-
Method: POST
-
URL:
https://sheets.googleapis.com/v4/spreadsheets -
Authentication: Predefined Credential Type
-
Credential Type: Google Sheets OAuth2 API
-
Google Sheets OAuth2 API: Add your Google Sheets Credentials
-
Send Headers: Checked
-
Specify Headers: Using Fields Below
Headers Parameters
- Name:
Content-Type - Value:
application/json
Body Configuration
- Send Body: Checked
- Body Content Type: JSON
- Specify Body: Using Fields Below
Body Parameters
- Name:
properties - Value:
{{ { "title": $json.spreadsheetTitle } }} - Name:
sheets - Value:
{{ $json.sheetData }}
At this point, the workflow can put the report in a spreadsheet and also a database (if you configured it earlier).
Stay with me, we are almost there!
Step 11: Merge Node
This node will do exactly what its name says. It will combine two incoming outputs: the first is from the last HTTP node, and the second will be from the Switch node (Output 1). This merge will give us data from the new spreadsheet, specifically the URL because we need it down the line, and the summarized data for the email template.
The configuration should look like this:
- Mode: Append
- Number of Inputs: 2
Step 12: Aggregate Node
Connect this to the Merge node. This will help us combine all incoming data into a single list.
Configuration:
- Aggregate: All Items Data (Into a single list)
- Put Output in Field: data
- Include: All Fields
Step 13: Gmail Node (Main Report)
Finally, it's time to prepare and send the report:
- Add your credential
- Resource: Message
- Operation: Send
- Subject:
Daily Sentiment Analysis Report - {{ $now.format('dd LLL yyyy') }} - HTML: Checked
- HTML Message:
<!DOCTYPE html>
<html>
  <head>
    <meta charset="UTF-8" />
    <meta name="viewport" content="width=device-width, initial-scale=1.0" />
    <style>
      * {
        margin: 0;
        padding: 0;
        box-sizing: border-box;
      }

      body {
        font-family: "Segoe UI", Tahoma, Geneva, Verdana, sans-serif;
        line-height: 1.6;
        color: #2c3e50;
        background: linear-gradient(135deg, #667eea 0%, #764ba2 100%);
        min-height: 100vh;
        padding: 20px;
      }

      .container {
        max-width: 800px;
        margin: 0 auto;
        background: white;
        box-shadow: 0 20px 40px rgba(0, 0, 0, 0.1);
        overflow: hidden;
      }

      .header {
        background: linear-gradient(135deg, #667eea 0%, #764ba2 100%);
        color: white;
        padding: 25px 20px;
        position: relative;
        overflow: hidden;
      }

      .header::before {
        content: "";
        position: absolute;
        top: -50%;
        right: -20%;
        width: 200px;
        height: 200px;
        background: rgba(255, 255, 255, 0.1);
      }

      .header h1 {
        font-size: 1.6em;
        font-weight: 700;
        margin-bottom: 10px;
        position: relative;
        z-index: 2;
      }

      .header-info {
        display: grid;
        grid-template-columns: repeat(3, 1fr);
        gap: 15px;
        margin-top: 15px;
        position: relative;
        z-index: 2;
      }

      .header-stat {
        background: rgba(255, 255, 255, 0.15);
        padding: 10px;
        backdrop-filter: blur(10px);
        border: 1px solid rgba(255, 255, 255, 0.2);
      }

      .header-stat label {
        font-size: 0.8em;
        opacity: 0.9;
        display: block;
        margin-bottom: 3px;
      }

      .header-stat value {
        font-size: 1.1em;
        font-weight: 600;
      }

      .content {
        padding: 25px 20px;
      }

      .section {
        margin-bottom: 25px;
      }

      .section h2 {
        font-size: 1.2em;
        font-weight: 600;
        color: #2c3e50;
        margin-bottom: 12px;
        position: relative;
        padding-left: 15px;
      }

      .section h2::before {
        content: "";
        position: absolute;
        left: 0;
        top: 50%;
        transform: translateY(-50%);
        width: 3px;
        height: 18px;
        background: linear-gradient(135deg, #667eea, #764ba2);
      }

      .sentiment-grid {
        display: grid;
        grid-template-columns: repeat(3, 1fr);
        gap: 12px;
        margin-top: 15px;
      }

      .metric {
        background: white;
        padding: 15px 12px;
        text-align: center;
        position: relative;
        transition: transform 0.3s ease, box-shadow 0.3s ease;
        border: 2px solid transparent;
      }

      .metric:hover {
        transform: translateY(-3px);
        box-shadow: 0 10px 20px rgba(0, 0, 0, 0.1);
      }

      .metric::before {
        content: "";
        position: absolute;
        top: 0;
        left: 0;
        right: 0;
        height: 3px;
      }

      .positive {
        border-color: #e8f8f5;
        background: linear-gradient(135deg, #d4edda, #c3e6cb);
      }

      .positive::before {
        background: linear-gradient(90deg, #28a745, #20c997);
      }

      .negative {
        border-color: #f8e8e8;
        background: linear-gradient(135deg, #f8d7da, #f5c6cb);
      }

      .negative::before {
        background: linear-gradient(90deg, #dc3545, #e74c3c);
      }

      .neutral {
        border-color: #fff8e1;
        background: linear-gradient(135deg, #fff3cd, #ffeaa7);
      }

      .neutral::before {
        background: linear-gradient(90deg, #ffc107, #f39c12);
      }

      .metric-value {
        font-size: 1.8em;
        font-weight: 700;
        color: #2c3e50;
        margin-bottom: 5px;
        line-height: 1;
      }

      .metric-label {
        font-size: 0.8em;
        color: #6c757d;
        font-weight: 500;
      }

      .data-table {
        background: white;
        overflow: hidden;
        box-shadow: 0 2px 8px rgba(0, 0, 0, 0.08);
        border: 1px solid #e9ecef;
      }

      table {
        width: 100%;
        border-collapse: collapse;
      }

      th {
        background: linear-gradient(135deg, #f8f9fa, #e9ecef);
        color: #495057;
        font-weight: 600;
        padding: 12px 15px;
        text-align: left;
        font-size: 0.85em;
        letter-spacing: 0.3px;
      }

      td {
        padding: 10px 15px;
        color: #6c757d;
        border-bottom: 1px solid #f8f9fa;
        transition: background-color 0.2s ease;
      }

      tr:hover td {
        background-color: #f8f9fa;
      }

      tr:last-child td {
        border-bottom: none;
      }

      .footer {
        background: #f8f9fa;
        padding: 20px;
        text-align: center;
        border-top: 1px solid #e9ecef;
        color: #6c757d;
        font-style: italic;
        font-size: 0.85em;
      }

      @media (max-width: 600px) {
        body {
          padding: 10px;
        }

        .header,
        .content {
          padding: 25px 20px;
        }

        .header h1 {
          font-size: 1.8em;
        }

        .sentiment-grid {
          grid-template-columns: 1fr;
        }

        .metric-value {
          font-size: 2em;
        }
      }
    </style>
  </head>
  <body>
    <div class="container">
      <div class="header">
        <h1>Sentiment Analysis Report</h1>
        <div class="header-info">
          <div class="header-stat">
            <label>Analysis Date</label>
            <div>{{ $now.format('dd LLL yyyy') }}</div>
          </div>
          <div class="header-stat">
            <label>Total Entries</label>
            <div>{{ $json.total_entries }}</div>
          </div>
          <div class="header-stat">
            <label>Avg. Confidence</label>
            <div>{{ $json.avg_confidence }}%</div>
          </div>
        </div>
      </div>

      <div class="content">
        <div class="section">
          <h2>Sentiment Overview</h2>
          <div class="sentiment-grid">
            <div class="metric positive">
              <div class="metric-value">
                {{ $json.data[2].positive_percentage }}%
              </div>
              <div class="metric-label">
                Positive ({{ $json.data[2].positive }})
              </div>
            </div>
            <div class="metric negative">
              <div class="metric-value">
                {{ $json.data[2].negative_percentage }}%
              </div>
              <div class="metric-label">
                Negative ({{ $json.data[2].negative }})
              </div>
            </div>
            <div class="metric neutral">
              <div class="metric-value">
                {{ $json.data[2].neutral_percentage }}%
              </div>
              <div class="metric-label">
                Neutral ({{ $json.data[2].neutral }} )
              </div>
            </div>
          </div>
        </div>

        <div class="section">
          <h2>Data Sources</h2>
          <div class="data-table">
            <table>
              <tr>
                <th>Source</th>
                <th>Count</th>
              </tr>
              {{ $json.data[2].sourcesTableRows }}
            </table>
          </div>
        </div>

        <div class="section">
          <h2>Key Indicators</h2>
          <div class="data-table">
            <table>
              <tr>
                <th>Indicator</th>
                <th>Frequency</th>
              </tr>
              {{ $json.data[2].indicatorsTableRows }}
            </table>
          </div>
        </div>
        <p>
          Please check the report here:
          <a
            href="https://docs.google.com/spreadsheets/d/1_9SRSsja12KpY0grswHzLkFDFzkg9A3tNyerIkww4nk/edit?usp=sharing"
            >Google Sheets</a
          >
        </p>
      </div>

      <div class="footer">
        <p>
          This report was automatically generated by your n8n sentiment analysis
          workflow
        </p>
      </div>
    </div>
  </body>
</html>
- To Email: Add recipient email address
If you've gotten to this point, you've just set up a sentiment analysis system that does all we described earlier. If you run the workflow again, the summary email should be in your inbox with the detailed spreadsheet report.
Congratulations!
You can stop here if you want, but if you'd like to take it a step further by sending alert emails when the analysis exceeds a specific percentage, then let's continue.
Bonus: Alert System
We'll take a step back to the Switch node.
Step 14: If Node (Alert Condition)
Connect Output 1 from the Switch node to an If node and use the following settings:
Conditions
- String
- Value 1:
{{ $json.negative_percentage }} - Operation: largerThan
- Value 2:
60 - Combine: ALL
Step 15: Gmail Node (Alert Email)
- Add your credential
- Resource: Message
- Operation: Send
- Subject:
🚨 HIGH NEGATIVE SENTIMENT ALERT - {{ $now.format('dd LLL yyyy') }} - HTML: Checked
- HTML Message:
<!DOCTYPE html>
<html>
  <head>
    <meta charset="UTF-8" />
    <meta name="viewport" content="width=device-width, initial-scale=1.0" />
    <style>
      * {
        margin: 0;
        padding: 0;
        box-sizing: border-box;
      }

      body {
        font-family: "Segoe UI", Tahoma, Geneva, Verdana, sans-serif;
        line-height: 1.6;
        color: #2c3e50;
        background: linear-gradient(135deg, #e74c3c 0%, #c0392b 100%);
        min-height: 100vh;
        padding: 15px;
      }

      .container {
        max-width: 600px;
        margin: 0 auto;
        background: white;
        box-shadow: 0 15px 30px rgba(0, 0, 0, 0.2);
        overflow: hidden;
      }

      .alert-header {
        background: linear-gradient(135deg, #e74c3c 0%, #c0392b 100%);
        color: white;
        padding: 20px 15px;
        text-align: center;
        position: relative;
        overflow: hidden;
      }

      .alert-header::before {
        content: "";
        position: absolute;
        top: -30%;
        right: -15%;
        width: 150px;
        height: 150px;
        background: rgba(255, 255, 255, 0.1);
      }

      .alert-title {
        font-size: 1.4em;
        font-weight: 700;
        margin-bottom: 8px;
        position: relative;
        z-index: 2;
        letter-spacing: 0.5px;
        text-transform: uppercase;
      }

      .alert-subtitle {
        font-size: 0.9em;
        opacity: 0.95;
        position: relative;
        z-index: 2;
      }

      .content {
        padding: 20px 15px;
      }

      .metrics-section {
        margin-bottom: 20px;
      }

      .section-title {
        font-size: 1.1em;
        font-weight: 600;
        color: #2c3e50;
        margin-bottom: 10px;
        position: relative;
        padding-left: 12px;
      }

      .section-title::before {
        content: "";
        position: absolute;
        left: 0;
        top: 50%;
        transform: translateY(-50%);
        width: 3px;
        height: 16px;
        background: linear-gradient(135deg, #e74c3c, #c0392b);
      }

      .metrics-grid {
        display: grid;
        grid-template-columns: repeat(3, 1fr);
        gap: 10px;
        margin-top: 10px;
      }

      .metric-card {
        background: linear-gradient(135deg, #f8d7da, #f5c6cb);
        padding: 12px 8px;
        text-align: center;
        border: 2px solid #f1aeb5;
        position: relative;
      }

      .metric-card::before {
        content: "";
        position: absolute;
        top: 0;
        left: 0;
        right: 0;
        height: 3px;
        background: linear-gradient(90deg, #e74c3c, #c0392b);
      }

      .metric-value {
        font-size: 1.5em;
        font-weight: 700;
        color: #721c24;
        margin-bottom: 3px;
        line-height: 1;
      }

      .metric-label {
        font-size: 0.75em;
        color: #856404;
        font-weight: 500;
      }

      .data-list {
        background: #f8f9fa;
        padding: 12px;
        margin-top: 10px;
        border-left: 3px solid #e74c3c;
      }

      .data-item {
        font-size: 0.85em;
        color: #495057;
        margin-bottom: 5px;
        padding-left: 8px;
        position: relative;
      }

      .data-item::before {
        content: "•";
        position: absolute;
        left: 0;
        color: #e74c3c;
        font-weight: bold;
      }

      .data-item:last-child {
        margin-bottom: 0;
      }

      .timestamp {
        background: #e9ecef;
        padding: 10px;
        text-align: center;
        color: #6c757d;
        font-size: 0.8em;
        border-top: 1px solid #dee2e6;
      }

      .action-note {
        background: linear-gradient(135deg, #fff3cd, #ffeaa7);
        padding: 12px;
        margin: 15px 0;
        border-left: 3px solid #ffc107;
        font-size: 0.85em;
        color: #856404;
      }

      .footer {
        background: #f8f9fa;
        padding: 15px;
        text-align: center;
        border-top: 1px solid #e9ecef;
        color: #6c757d;
        font-style: italic;
        font-size: 0.8em;
      }

      @media (max-width: 500px) {
        body {
          padding: 8px;
        }

        .alert-header,
        .content {
          padding: 15px 12px;
        }

        .metrics-grid {
          grid-template-columns: 1fr;
          gap: 8px;
        }

        .alert-title {
          font-size: 1.2em;
        }

        .metric-value {
          font-size: 1.3em;
        }
      }
    </style>
  </head>
  <body>
    <div class="container">
      <div class="alert-header">
        <div class="alert-title">SENTIMENT ALERT</div>
        <div class="alert-subtitle">
          High negative sentiment detected for the company!
        </div>
      </div>

      <div class="content">
        <div class="metrics-section">
          <div class="section-title">Current Metrics</div>
          <div class="metrics-grid">
            <div class="metric-card">
              <div class="metric-value">{{ $json.negative_percentage }}%</div>
              <div class="metric-label">Negative Sentiment</div>
            </div>
            <div class="metric-card">
              <div class="metric-value">{{ $json.total_entries }}</div>
              <div class="metric-label">Total Entries</div>
            </div>
            <div class="metric-card">
              <div class="metric-value">
                {{ ($json.avg_confidence * 100).toFixed(1) }}%
              </div>
              <div class="metric-label">Avg Confidence</div>
            </div>
          </div>
        </div>

        <div class="metrics-section">
          <div class="section-title">Top Negative Indicators</div>
          <div class="data-list">
            {{ Object.entries($json.top_indicators).map(([indicator, count]) =>
            `
            <div class="data-item">${indicator}: ${count} mentions</div>
            `).join('') }}
          </div>
        </div>

        <div class="metrics-section">
          <div class="section-title">Data Sources</div>
          <div class="data-list">
            {{ Object.entries($json.sources).map(([source, count]) => `
            <div class="data-item">${source}: ${count} entries</div>
            `).join('') }}
          </div>
        </div>

        <div class="action-note">
          <strong>Action Required:</strong> Please review the detailed sentiment
          analysis and consider taking appropriate action.
        </div>
      </div>

      <div class="timestamp">Analysis Time: {{ $json.analysis_timestamp }}</div>

      <div class="footer">
        <p>
          This is an automated alert from the n8n sentiment monitoring system.
        </p>
      </div>
    </div>
  </body>
</html>
- To Email: Add recipient email address
Conclusion
Congratulations once again, because we've truly come to the end of this guide. You did it!
This is what your final workflow should look like at this point:
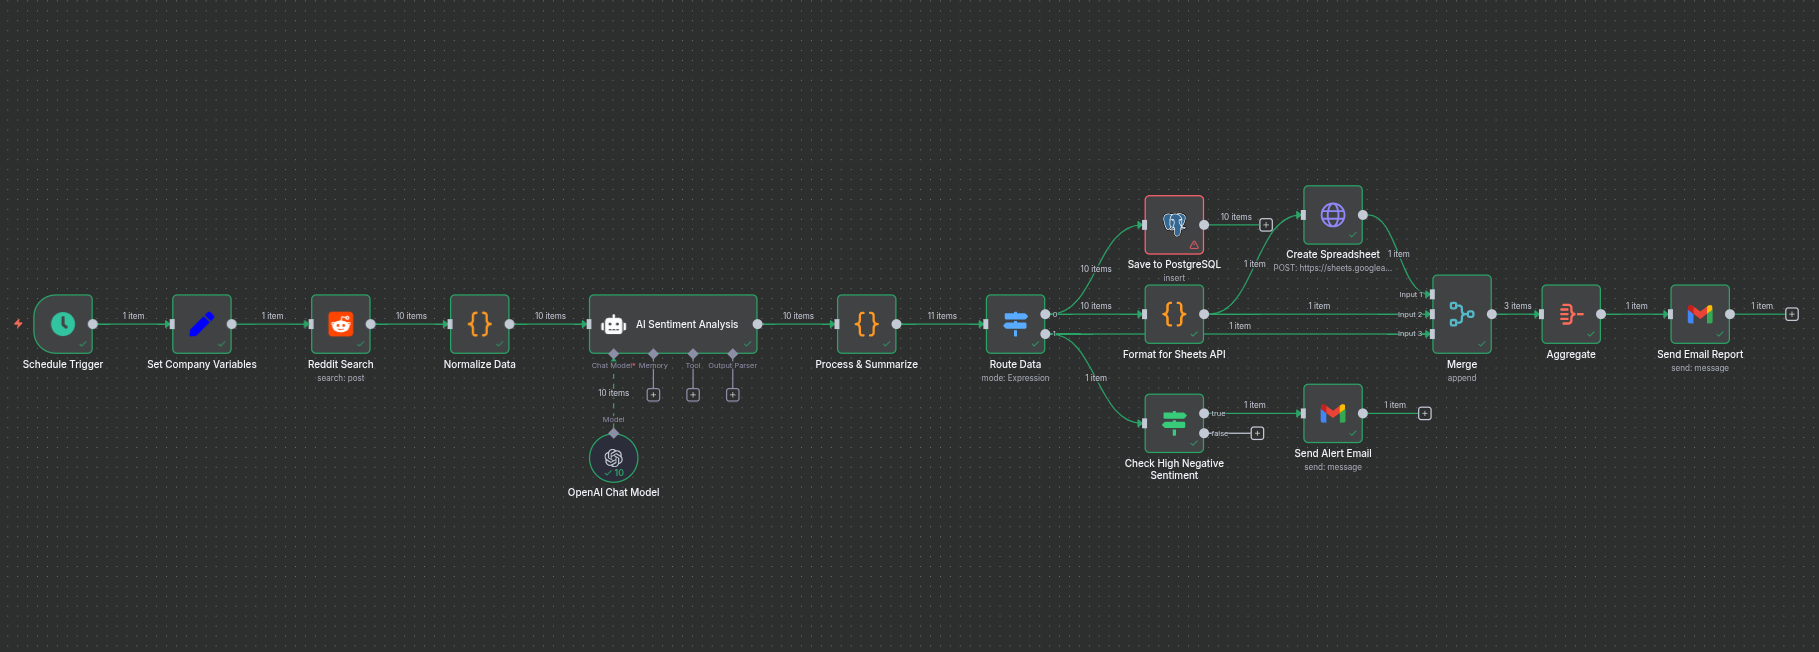
You now have a complete sentiment analysis workflow that:
- Automatically searches Reddit for mentions of your brand/company
- Analyzes sentiment using AI
- Saves detailed results to a database
- Creates formatted spreadsheet reports
- Sends daily email summaries
- Triggers alerts for high negative sentiment
This automated system will keep you informed about public sentiment regarding your brand, helping you stay ahead of potential issues and understand customer perception in real-time.
This sentiment analysis workflow is just one example of how n8n can transform your business operations. If you're looking to automate data analysis, customer support, or other complex tasks for your business, I'd love to help you build a custom n8n solution. Let's make your operations smarter and more efficient. Get in touch